
The associated color legend is as follows:
White : 0-15 visible stars (without planets) according to the conditions. Very high level of light pollution and all around. Typical of big urban centre and big regional and national cities.
Magenta : 25-80 visible stars. Principles constellations began to be recognizable.
Red : 80-150 stars : constellations and others stars appears. In a telescope, Some Messier object began to be observable.
Orange : 150-250 stars in good conditions. The light pollution is present all around but some darks areas appears. Typicaly the middle suburbs.
Yellow : 250-500 stars. Strong light pollution but the Milky Way can appear in good conditions. Some Messiers among the most bright can be visible with the necked eye.
Green : 500-1000 stars : far peacefull suburbs, Milky Way many times visible but very sensitive to the atmospheric conditions. Typicaly, the glare of light pollution take a large place in the sky and reach at 40-50° of elevation.
Cyan : 1000-1500 stars. The Milky Way is visible most of the time in fonction of climatic conditions but without contrast.
Blue : 1500-2000 stars. Good sky. The Milky Way is easily visible, we began to have the sensation of a good sky, but, some source of light pollution damage the sky and in a second time the sky by reflexion at the vertical of the observer.
Night blue : 2000-3000 stars. Very good sky. The Milky Way is present and powerfull. The light glares are far away and scaterred, they don't affect the sky quality.
Black (gree by texture transparency) : more than 3000 stars. No light pollution problems revealable on the sky quality
The following picture shows in detail de area around ESAC.
 The advantadge of the simulation is that the spatial resolution that can be achieved depends on the resolution of the used cartographic base. Direct estimations of light pollution are based in the direct measurements of the DMSP satellites . But in this case the best achieved obtained resolution is around 10 km.
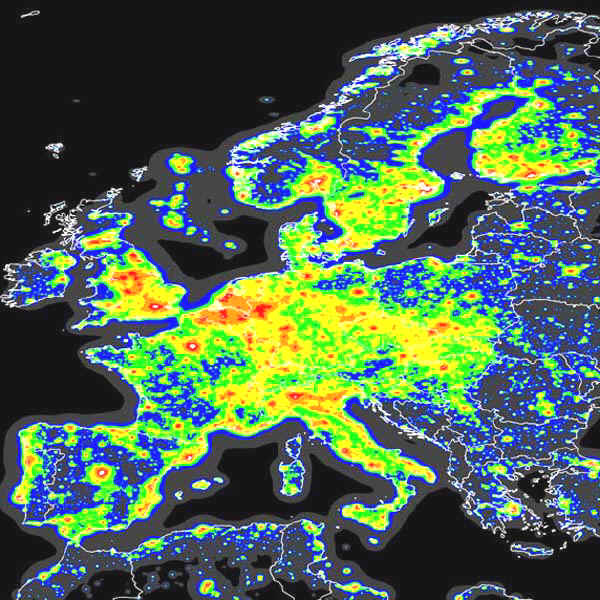

